Quant Reports · Published
Where the fantasy edge went: four seasons of data
Read as Markdown · JSON · Interactive board
Dated research snapshot. Conclusions apply to the populations and test periods described; this is not a current player recommendation.
Around 2022 you could beat most of a fantasy league with a spreadsheet. We know because we replayed one. Take real leagues, real rosters, real schedules, and every week start whichever eligible player has scored more per game so far. No injury reports, no matchups, no news, just a sort.
In 2022 that policy outscored the lineups managers actually submitted by six to eight and a half points a week, depending on format. Over a season that's the difference between a playoff team and a lottery pick, handed out for following a default sort order.
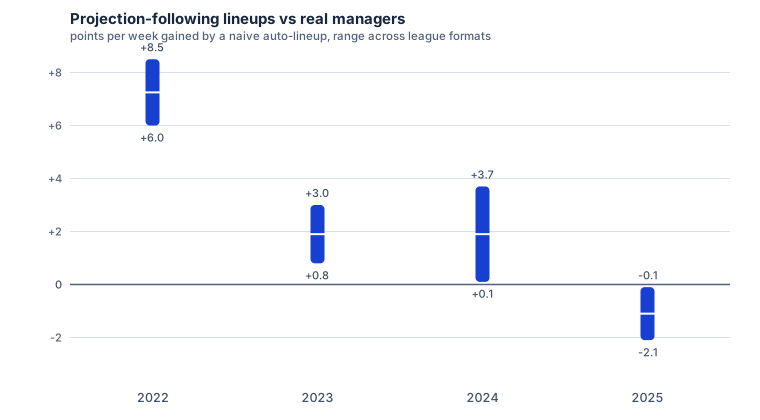
Run the same replay a year later and the gain drops to one to three points. By 2024 it's roughly a wash. In 2025 the naive policy loses to real managers in every format we track, by as much as two points a week. The replay is identical from year to year, so what moved has to be the managers. (All replays score each league under its own rules and stop before fantasy playoffs, because eliminated managers stop setting lineups and beating an abandoned roster proves nothing.)
Our explanation is boring. Projections used to be a website you visited. Now they're the number printed on every player card in every app, and the optimal-lineup button sits one tap away. The median manager in 2025 submits something close to the projection-optimal lineup most weeks. What's left of the weekly gap comes from news that breaks between Thursday and kickoff, which humans still handle, and from attention lapses, which some humans still have.
We spent a long time this offseason trying to build a weekly projection model that beats the platform numbers, with every advanced stat we could get our hands on. Opportunity-value models built from play by play, snap shares, air yards, schedule-adjusted defensive strength, Vegas lines, weather, practice reports. None of it produced a better weekly ranking than what your app already shows. Anyone selling you weekly rankings as an edge is describing 2022.
What still separates drafters
If everyone has the same numbers, the leagues should be coin flips by now, and they aren't. Some managers finish near the top of their league year after year, and the drafts are where a lot of that shows up.
The test we ran scores thousands of drafted rosters on a clean question: how many points the roster could have produced with perfect hindsight lineups, using only drafted players. No waiver credit, no trade credit, no lineup skill. Percentile that within each league, and managers with repeat top finishes across multiple seasons emerge. Then compare what the top tenth of drafters do at the podium against the bottom tenth, across about seven thousand picks.
Structurally the two groups barely differ. They draft nearly identical RB and WR mixes. Their appetite for rookies is close. What separates them is how far they deviate from the market's draft order.
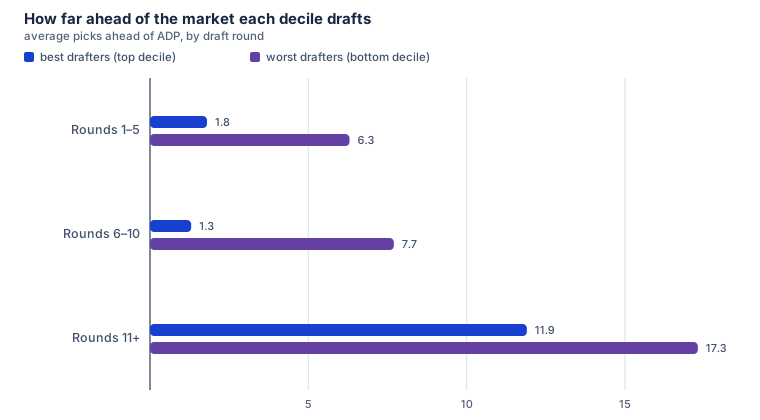
Through ten rounds, the best drafters pick players an average of one to two spots ahead of ADP, which is to say they draft at market. The worst drafters jump players six to eight spots early, round after round. Late in drafts everyone reaches, ADP means little after round eleven, and the gap still holds there. One secondary habit worth naming: spending a top-five-round pick on a tight end shows up noticeably more in the bottom group.
ADP is the aggregate of thousands of recent drafts. Inside a round it's a decent ordering of players, priced by people wagering real rosters on it. Jumping a player eight spots is a claim that you know something the entire market missed. Occasionally somebody does, but mostly it's conviction, and conviction is expensive. Our read after staring at this for a while: a reach needs an argument that would move the market if it were public. Liking a player doesn't clear that bar.
The one projection bias that keeps showing up
Beating the weekly rankings is hard, as above. A projection carries more than an ordering, though. It also claims a level, the actual number of points, and at the level there's a bias that has survived every season we can measure.
Quarterback scoring comes in under projection, every year, by around two to three points a week once you compare it against how the rest of the board misses.
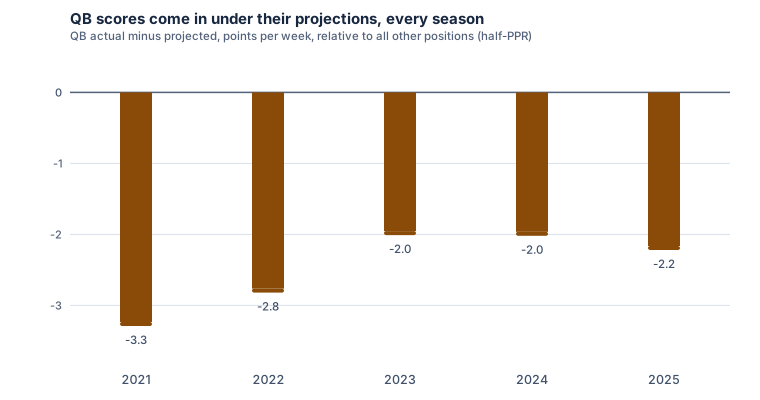
The order among QBs is fine. If the model likes one QB over another, trust it. What runs hot is the level of the whole position, and that bites anywhere you compare a QB number against a non-QB number. Superflex trade prices lean on it. Flex decisions in 2QB formats lean on it. A trade offer where a QB's projected points carry the value math leans on it hard.
A few things we can say about why, with less certainty than the effect itself. Quarterbacks who leave a game early rarely have a backup stat line to soften the miss. Blowouts end drives with kneel-downs. Projection models extrapolate rushing production forward at face value, and our season-level testing found rushing quarterbacks to be the single most overprojected profile in the data, with the biggest out-of-sample misses coming from exactly those players. High wind makes the whole thing worse, though the samples get thin enough there that we hold that one loosely.
The bias doesn't extend down the board. Skill players on hot streaks, the ones outscoring what their usage says they should, actually come in a touch above projection going forward rather than collapsing back. We expected mean reversion there and found almost none for RBs and receivers, which leaves the overshoot squarely at quarterback.
For the season ahead
Draft at market unless you hold an argument that would move the market. Treat weekly rankings as a floor everyone shares, and spend your attention on the last hours before kickoff, where news is still unpriced. When a decision crosses positions, especially anything involving a quarterback's raw projected points, shave the QB number before you compare.
We'll keep publishing what the data says as the season's captures accumulate.